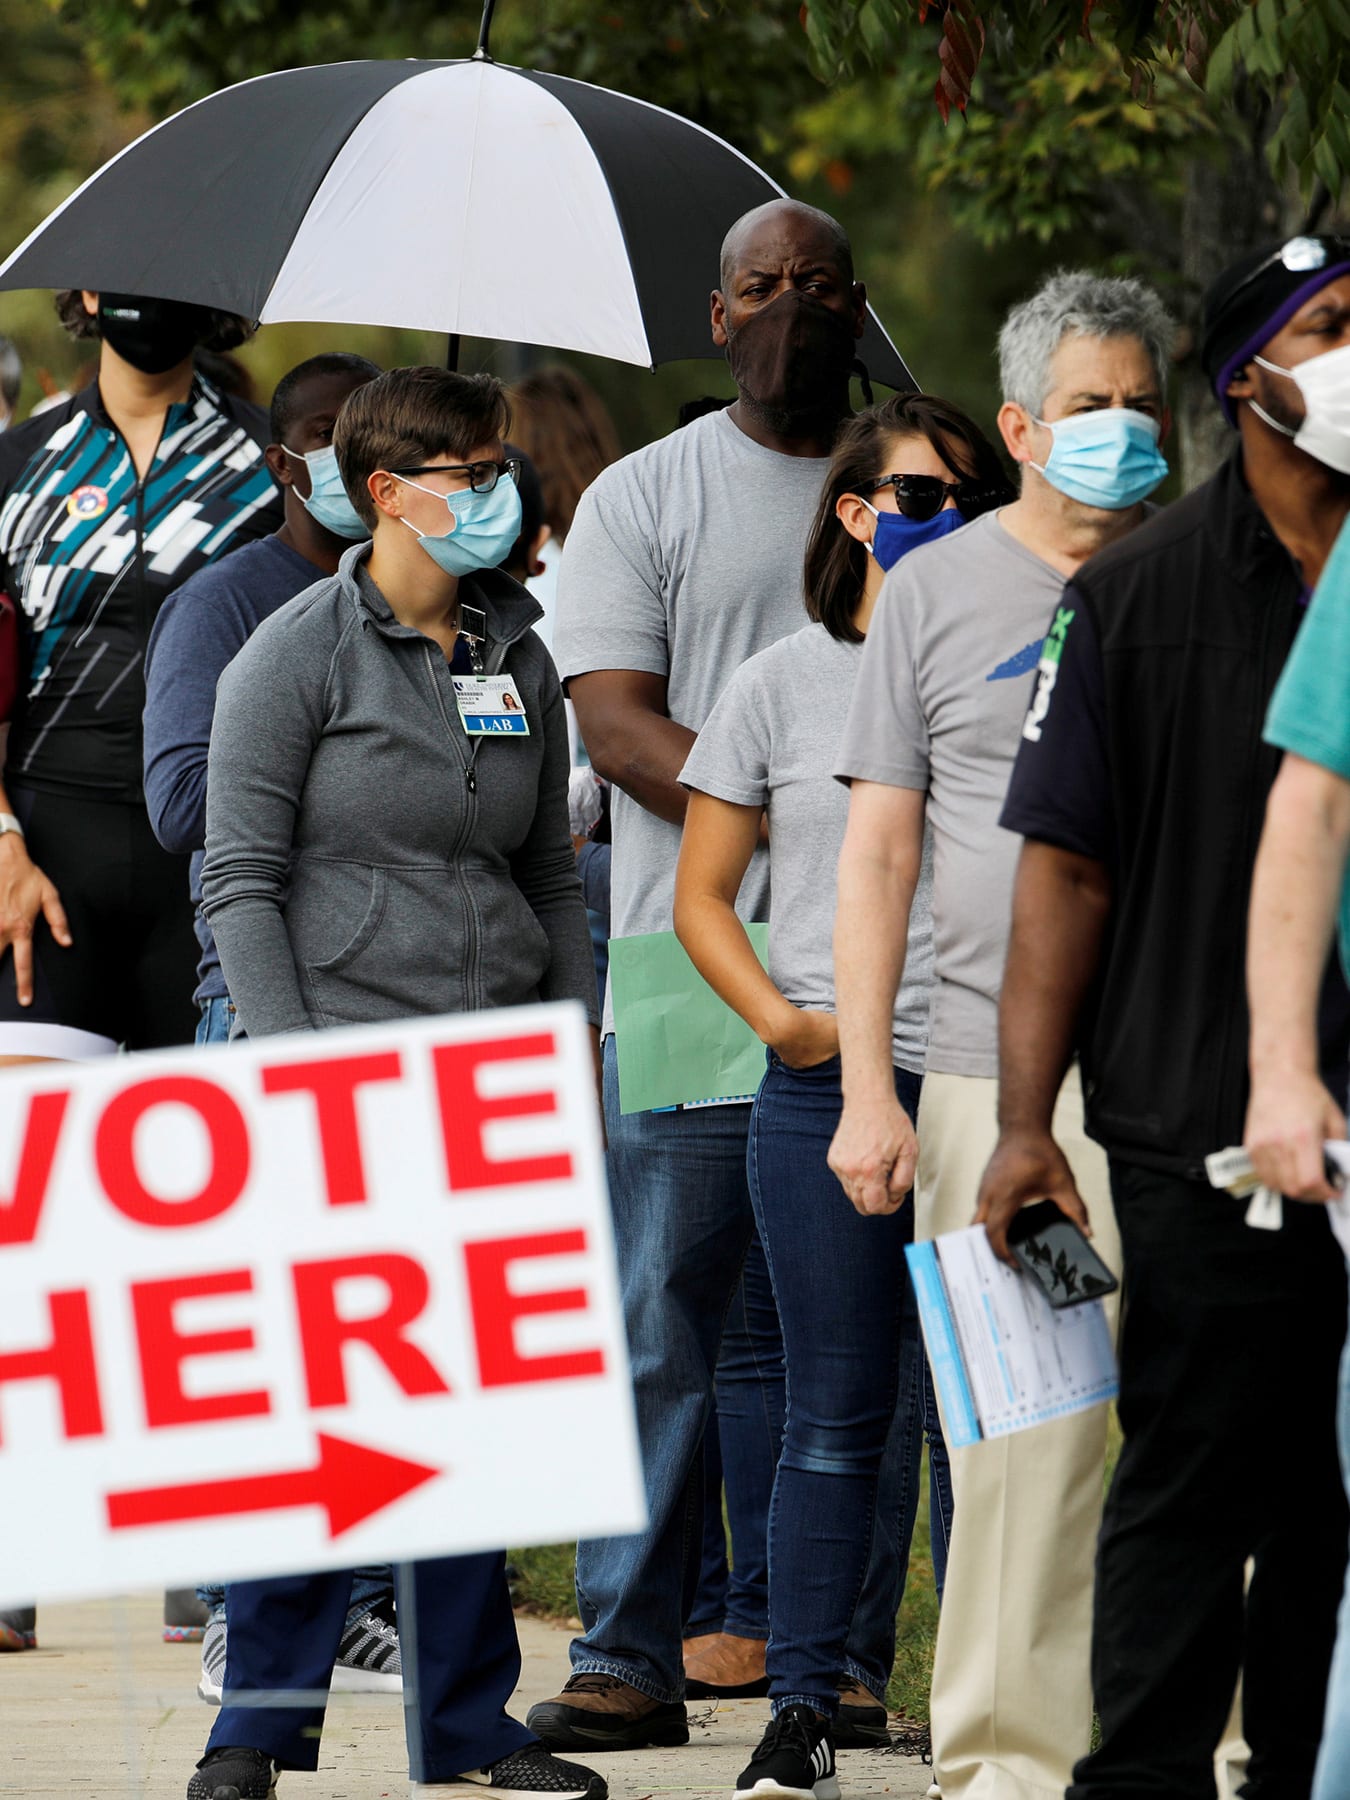
Americans head to the polls to vote next week on November 3. Voting in 2020 is unprecedented in many ways, mainly because of the novel coronavirus pandemic. As the two candidates make their final pushes into the last weekend of the campaign, the coronavirus is surging as well. Daily reported COVID-19 cases in the United States recently passed 80,000 per day, and the latest projections from the Institute for Health Metrics and Evaluation (IHME) at the University of Washington—where I work—suggest that the incidence of new infections will continue to increase in every state between October 23 and November 3.
MORE
Americans have already cast early ballots than in all of 2016
The advice from experts is that Americans should take proper precautions to protect themselves and their communities while exercising their right to vote. This includes considering options to vote early or vote by mail when possible. Early voting can reduce crowds and lines, and Americans have already cast more early ballots than in all of 2016. For those planning to vote on election day, the experts advise members of the public to observe social distancing and wear a mask.
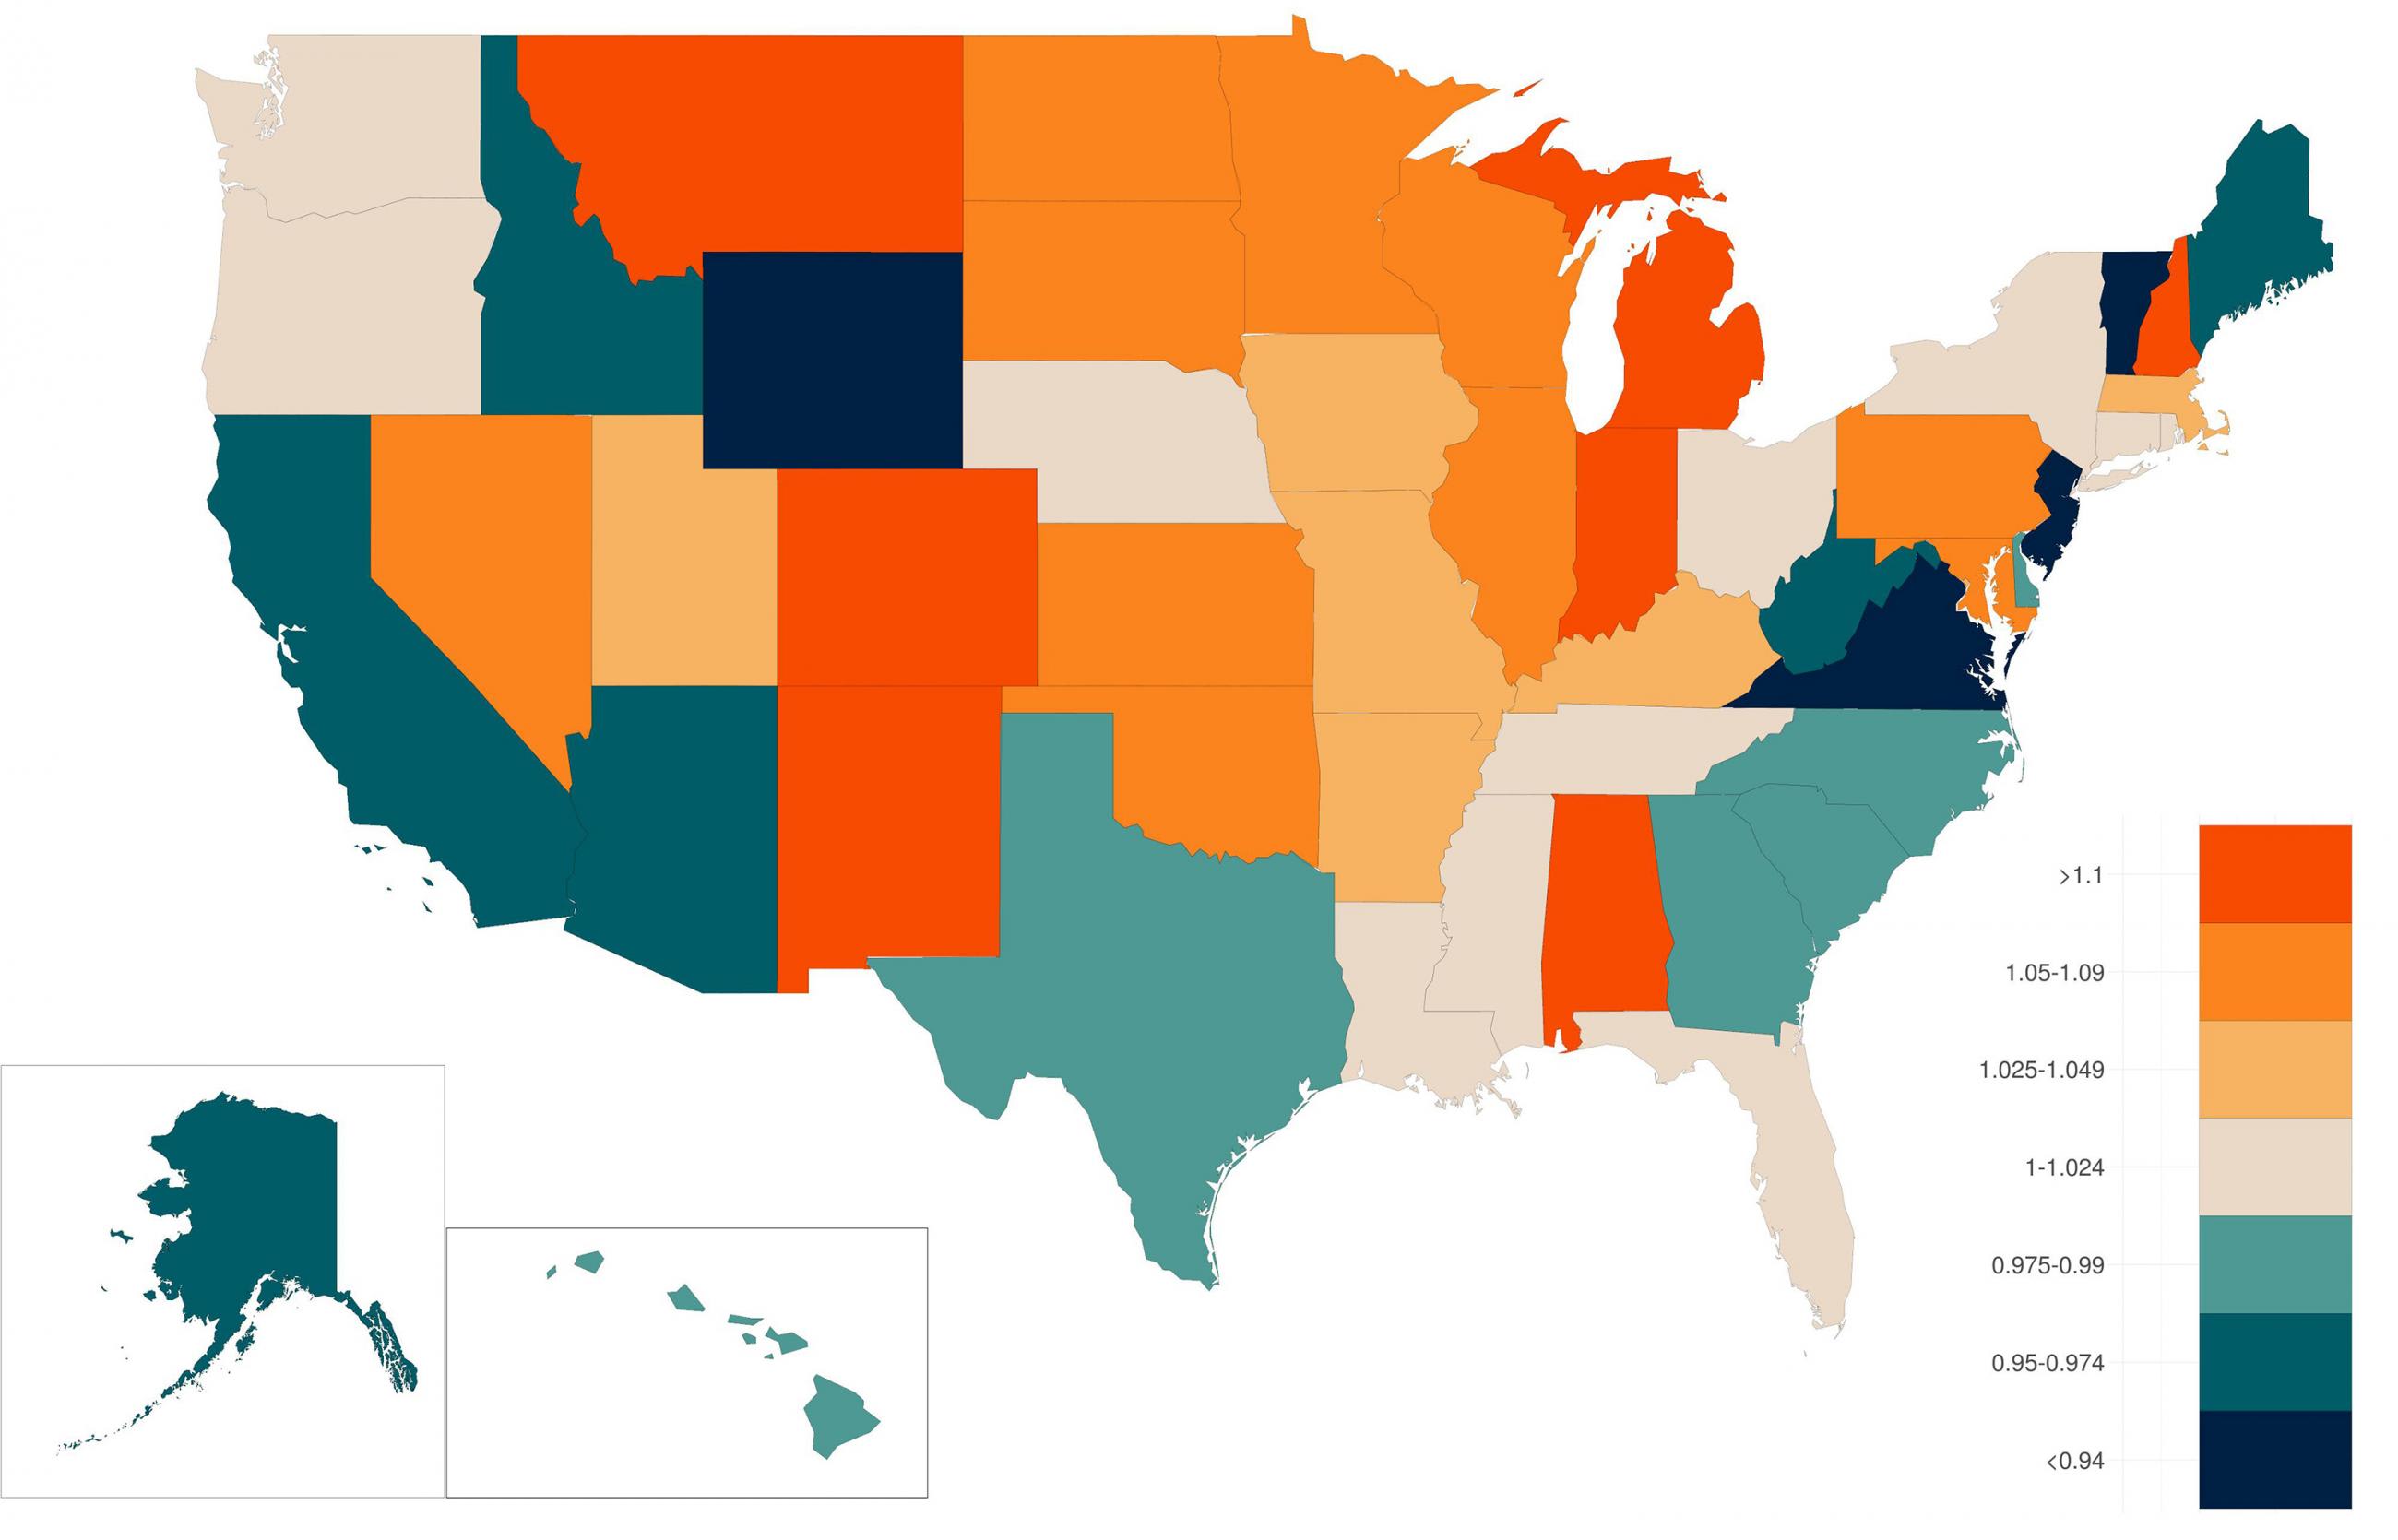
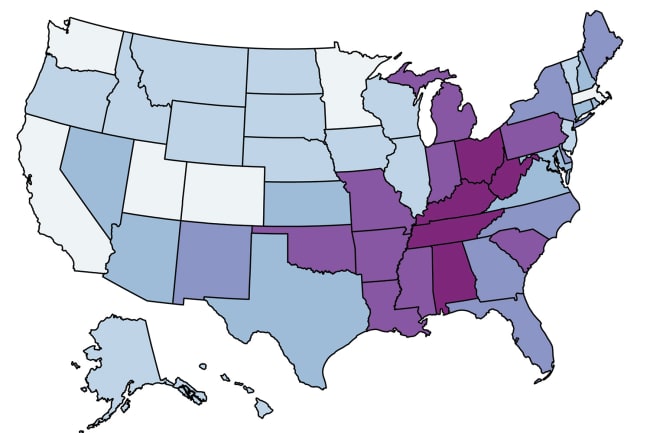
The map above shows the projected effective reproductive number (called effective R), which is an estimate of how many new infections occur on average per existing infection—or how many people on average already sick people infect. It was above one in thirty-five states and Washington DC on October 20, indicating increasing transmission in those states.
Changes in individual behavior now can decrease the forecasted new infections leading up to election day
The effective R is used to forecast infections over the near future because changes in individual behavior that lower the effective R will prevent infections in the next 10–14 days depending on how long people are infectious and the time between exposure and infectiousness. That means changes in individual behavior now can decrease the forecasted new infections leading up to election day. Avoiding social activities over the next ten days can help to reduce transmission—emerging evidence suggests that there is a growing role of small gatherings of friends and family contributing to transmission—and always wearing a mask when outside the home can protect the mask wearer and their community, reducing transmission by about 40 percent.
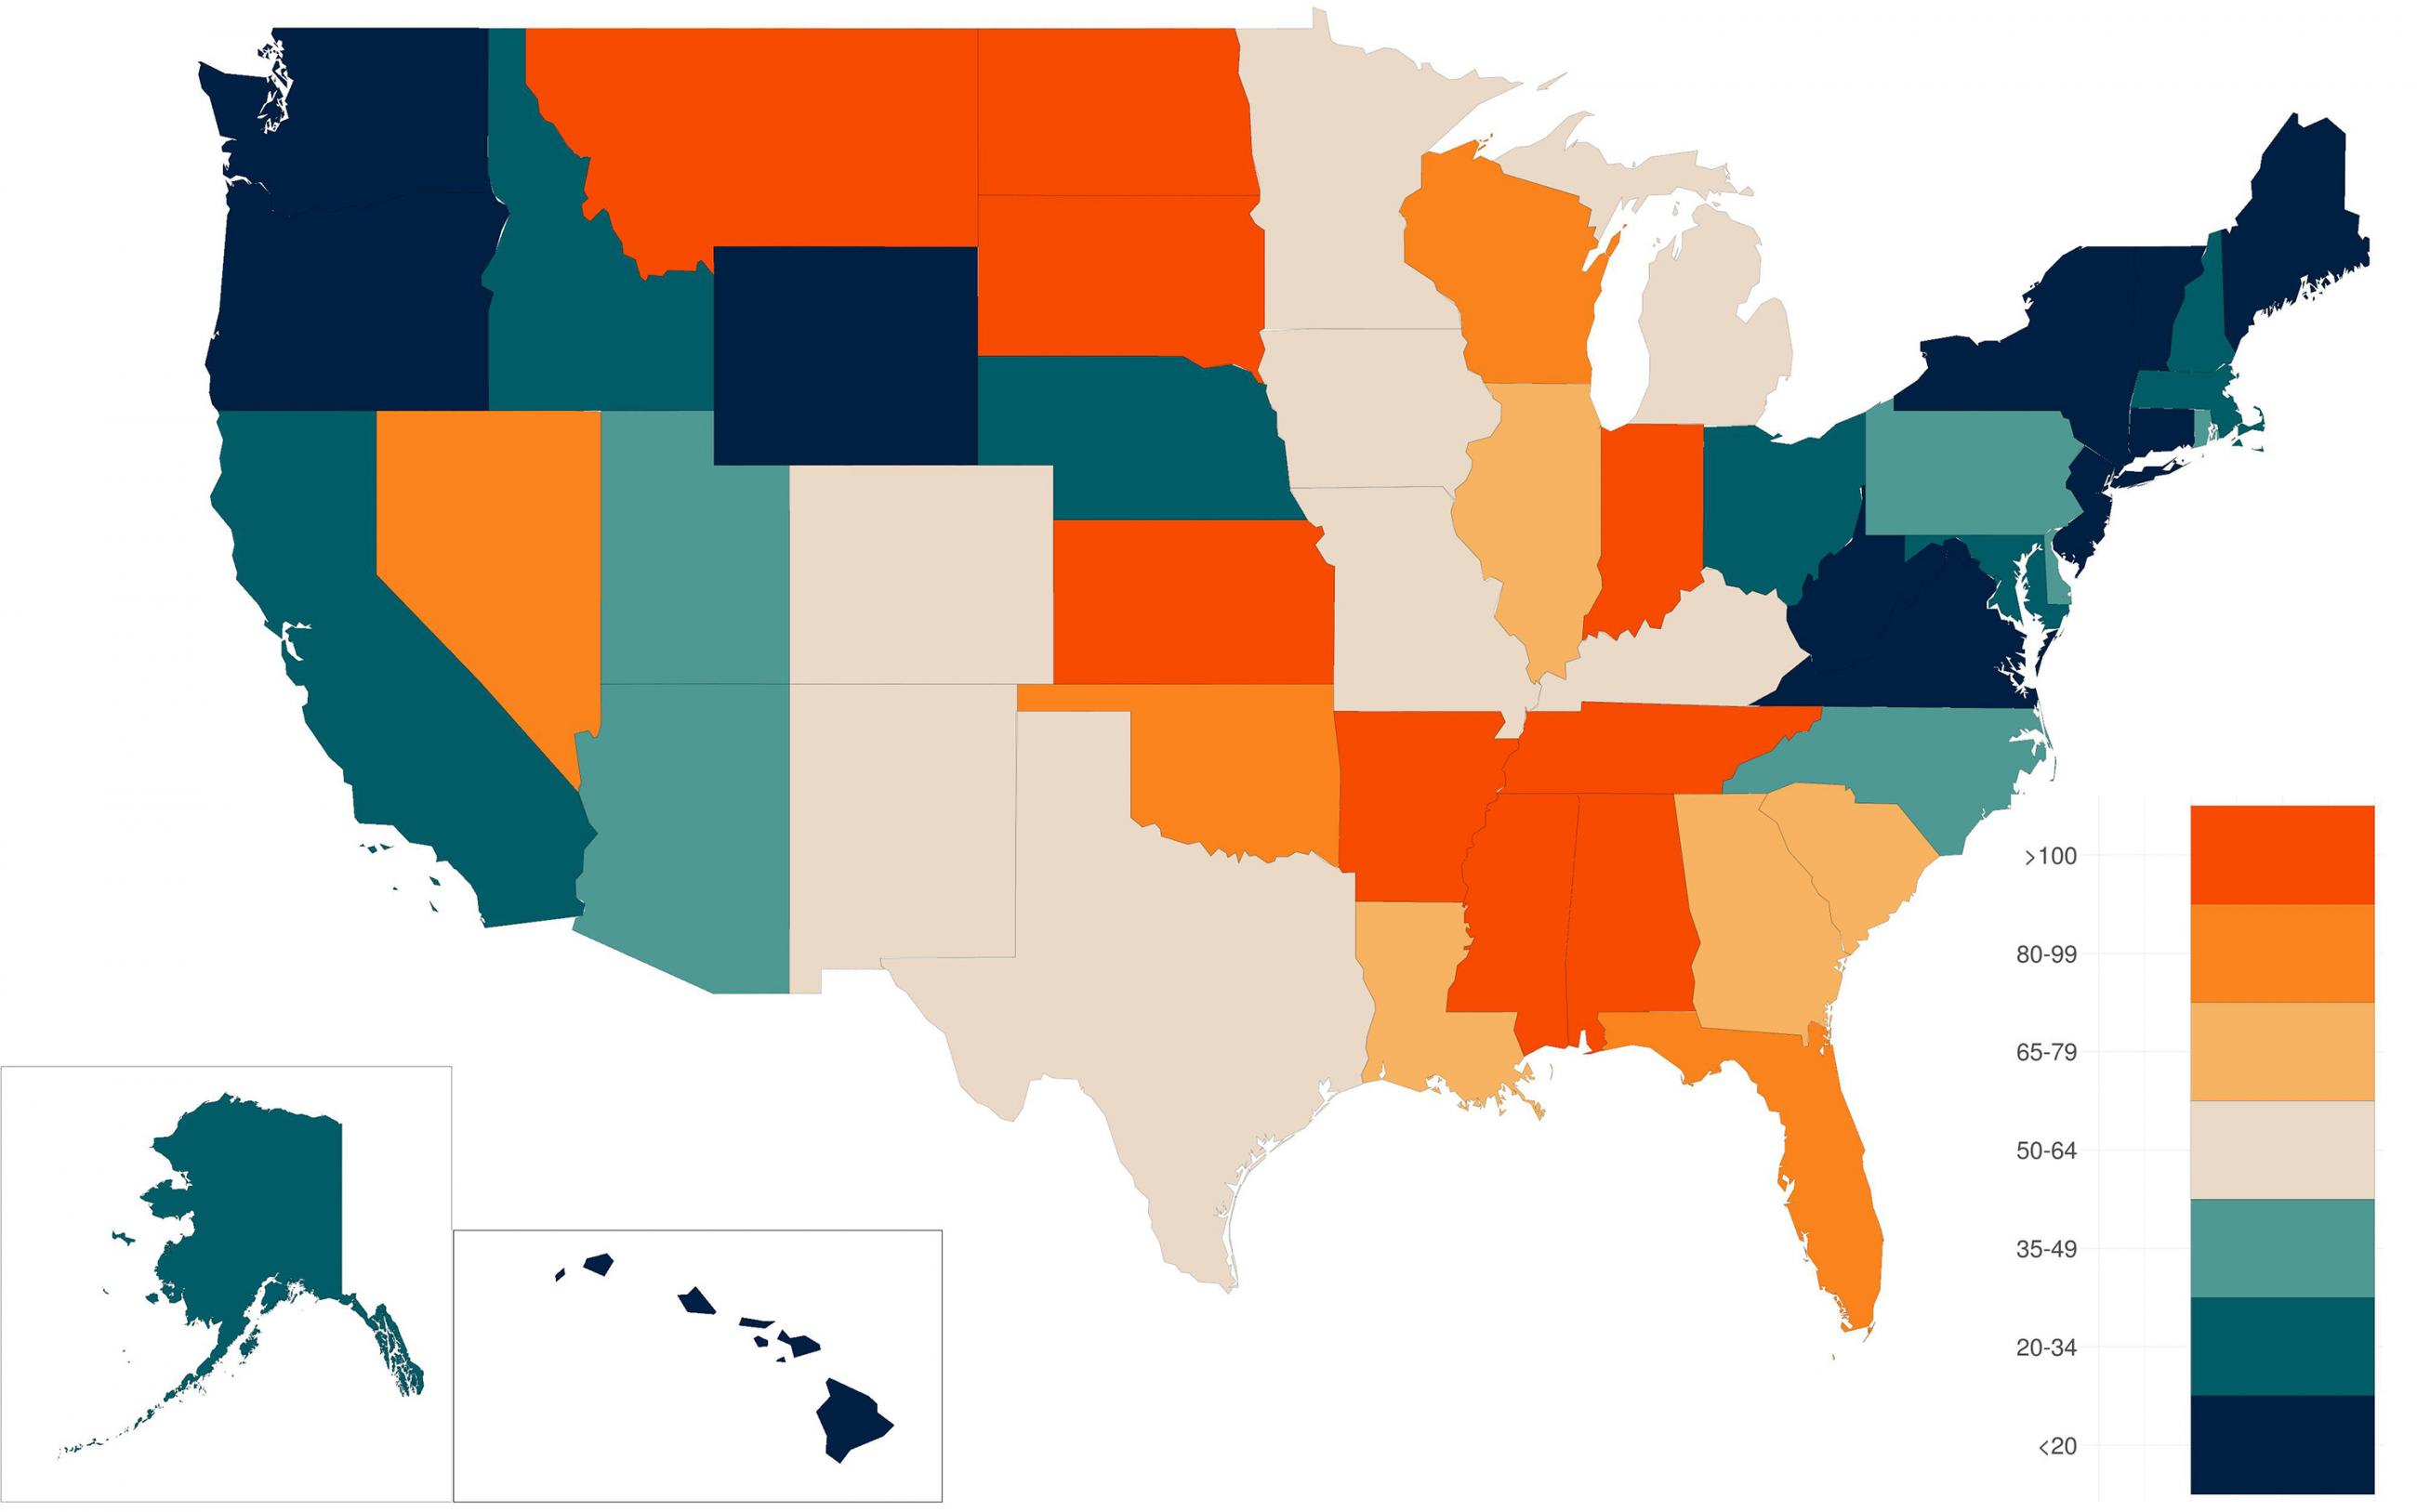
Coronavirus Infections Before and After the U.S. Election
Estimated incidence rates across the United States, showing new infections for every 100,000 people
Without any changes in individual behavior, like mask use and observing social distancing, we can expect the incidence of new infections will increase in all states between now and election day.
The highest incidence is projected to be in North Dakota
The largest relative increase in incidence is expected in the Great Lakes, Midwest, and Rocky Mountain regions, with Wyoming as a notable exception. The highest incidence is projected to be in North Dakota (over 300 new infections per 100,000 people) while the lowest is projected in Vermont (about 1 new infection per 100,000 people). The United States collectively is expected to have about 50 new infections per 100,000, representing an estimated 170,000 new infections per day on election day. Estimated infections include both people who have a positive COVID-19 test and would be considered a confirmed case and people who are asymptomatic or do not receive a test.
So the bottom line for people who want to be counted on election day is to be prepared and be safe.
EDITOR'S NOTE: The author is employed by the University of Washington's Institute for Health Metrics and Evaluation (IHME), which produced the COVID-19 forecasts described in this article. IHME collaborates with the Council on Foreign Relations on Think Global Health. All statements and views expressed in this article are solely those of the individual author and are not necessarily shared by their institution.