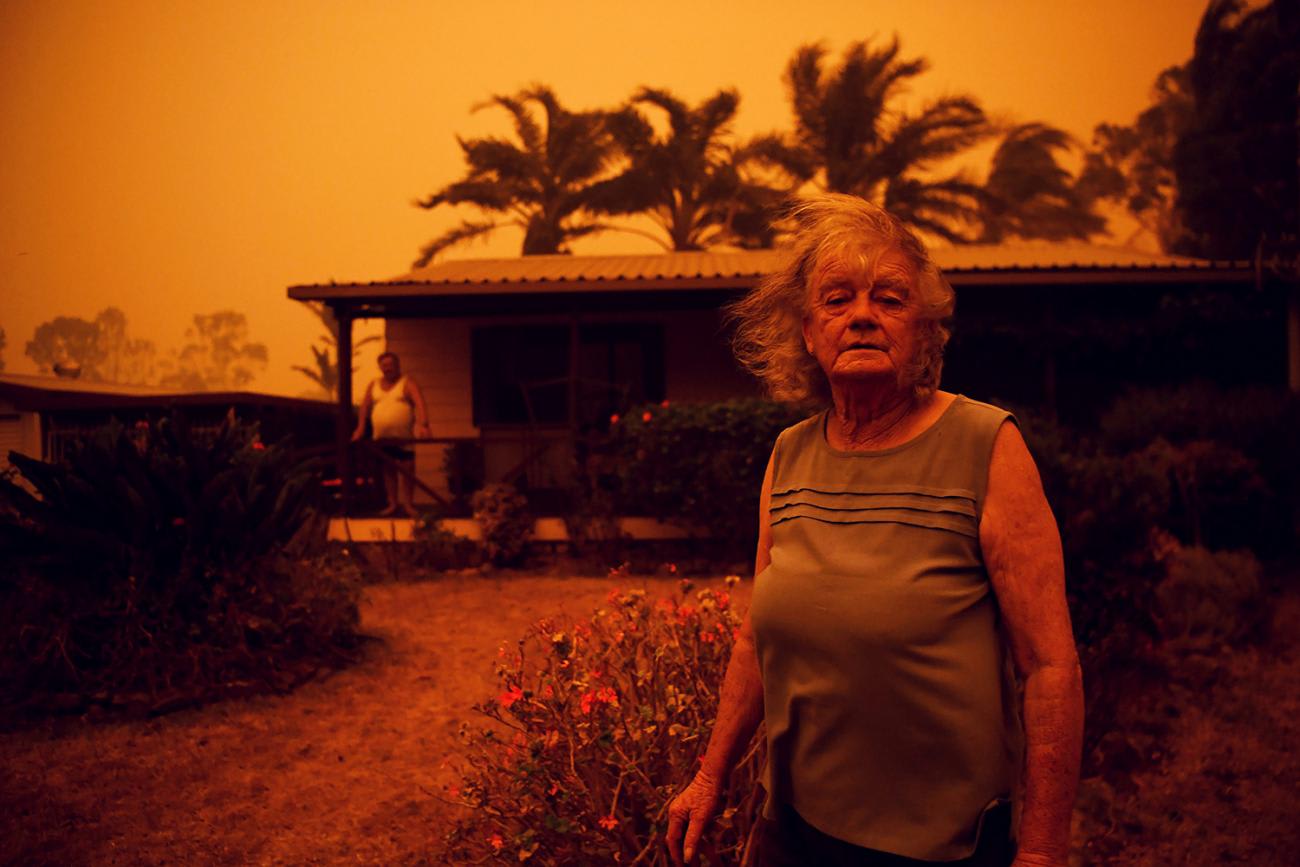
Wildfires are a natural part of the ecology and terrain in many parts of the world. Some animal and plant species, like giant Sequoia trees, have evolved to survive and even thrive in areas prone to periodic fires. That evolutionary intelligence is of little comfort to people forced to flee conflagrations, such as the residents of New South Wales who are facing the worst wildfires in Australia's history. Fires represent a direct danger to human lives, a threat to property and wildlife, and a risk factor for respiratory and cardiovascular diseases because of the smoke that they produce.
4.6 M
Deaths globally due to air pollution, 2017
During combustion, fires release massive quantities of particulate matter into the air. The particles that worry scientists the most are the nearly invisible ones that are smaller than 2.5 micrometers in diameter (PM2.5). These are very small—more than 20 times smaller than the width of an average human hair. These particles are especially dangerous for human health because they are able to reach tiny air sacs in the lungs, called alveoli, causing damage to the epithelial tissue. Breathing in particles this size has been linked to a variety of health outcomes such as ischemic heart disease, stroke, type 2 diabetes, low birth weight and short gestation, chronic obstructive pulmonary disease (COPD), and lower respiratory infections including pneumonia. Ambient and particulate matter pollution was responsible for about 4.6 million deaths globally in 2017, including about 1.9 million due to respiratory diseases, according to the Global Burden of Disease study led by the Institute for Health Metrics and Evaluation (IHME).
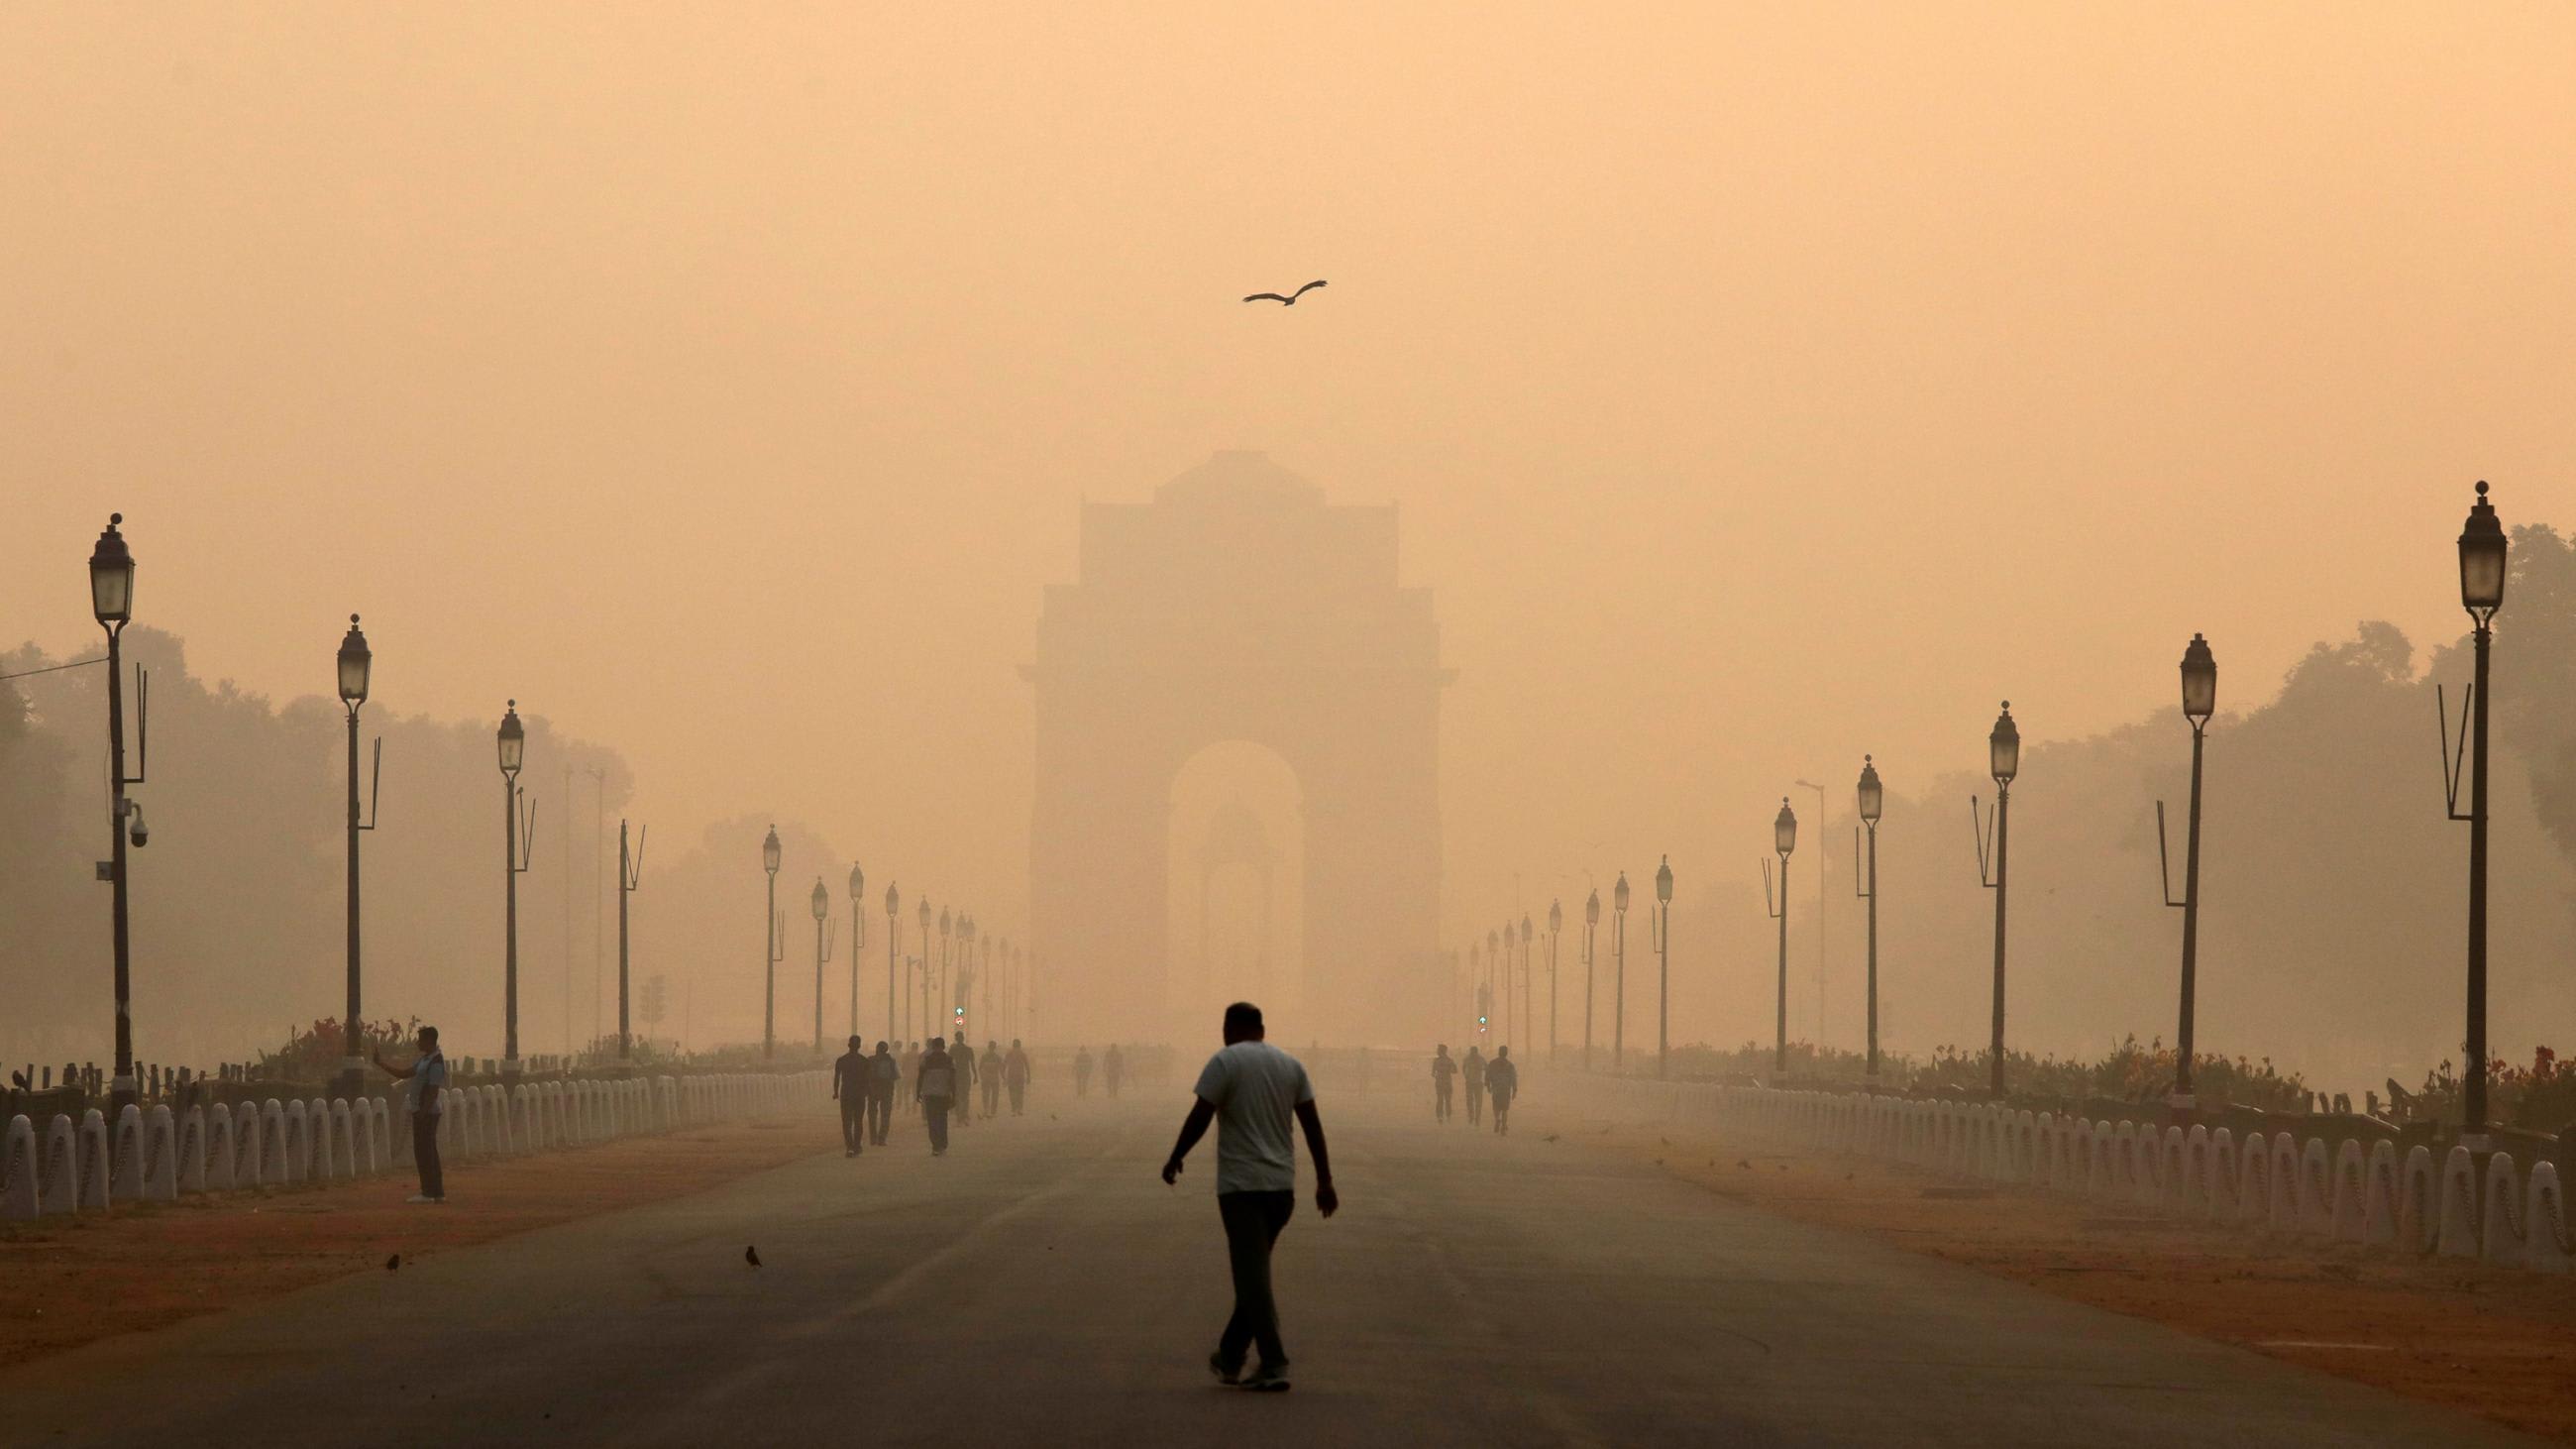
Existing standards and goals establish baseline levels of PM2.5 concentration in the air. The World Health Organization set a target of 10 micrograms per cubic meter (µg/m3) as the upper limit of PM2.5. Yet, by IHME estimates from the Institute for Health Metrics and Evaluation (IHME), more than 90 percent of the people in the world live in places above that level. Some of the world's most polluted cities, including Beijing (82 µg/m3) and Delhi (209 µg/m3) are well above that target.
The U.S. Environmental Protection Agency under the Clean Air Act set air quality standards to an annual mean of 15 µg/m3. In 2018, most cities in the United States met that goal. The highest mean annual concentration was 19.4 µg/m3 in Bakersfield, CA and the lowest was 2.6 µg/m3 in Kapaa, HI. Some of the largest cities on the west coast of the United States, like Los Angeles (13.3 µg/m3), San Francisco (14.4 µg/m3), and Seattle (9.3 µg/m3) were below that target level. Except during wildfires.
2017 California wildfires released as much CO2 in one week as all its cars and trucks did that year.
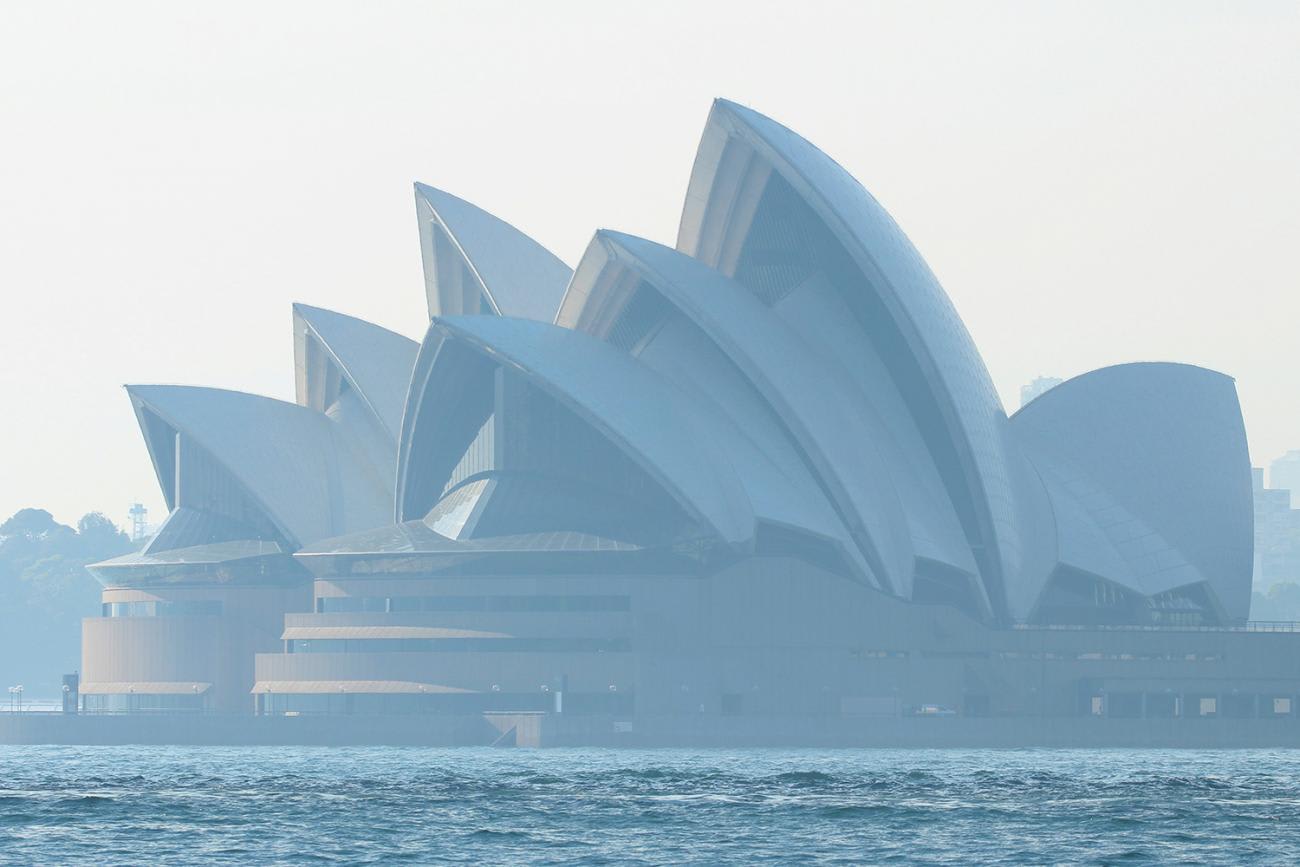
Wildfires have the potential to release massive amounts of pollutants into the atmosphere. Some estimates suggest that the 2017 wildfires in northern California released as much carbon dioxide, a different pollutant than PM2.5, in a single week as all the cars and trucks in California in a full year. In the summer and fall of 2018, over 600,000 acres burned across California including the deadly and destructive Camp and Woosley Fires. PM2.5 levels were recorded around 220 µg/m3 in San Francisco—air so foul that breathing it is like smoking half a pack of cigarettes a day. In 2018, fires in the Pacific Northwest blanketed Seattle in smoke and caused PM2.5 levels to exceed 150 µg/m3. Wildfires continued to burn across the American West in 2019 including an additional 250,000 acres in California. At present, bushfires are creating a hellish landscape in Eastern Australia. The fires have burned more than 11 million acres since September, have killed hundreds of millions of animals, and have killed at least ten people while displacing many more. The famous Sydney Opera House is nearly obscured in recent photos as PM2.5 concentration exceeded 300 µg/m3 in December 2019.
Wildfires are responsible for acute impacts on human health. The relative risk of lower respiratory infections and chronic obstructive pulmonary disease (COPD) increases sharply with increasing PM2.5 concentration. This means that the worse the wildfire, the more PM2.5 particles in the air, and the greater the relative risk of respiratory disease.
A relative risk is a concept from epidemiology that describes a ratio of risk in an exposed to an unexposed population. A relative risk of 1.2 corresponds to a 20 percent higher risk of disease than people at the lowest level of exposure to air pollution.
There were generally consistent increases in these diseases during wildfires
The amount of PM2.5 in the air in Bakersfield, CA on an average day produced a 20 percent increased risk of lower respiratory infections for people living there. A relative risk of 1.5, roughly the value for an average day in Beijing, means people living there have a 50 percent increased risk of worsening symptoms including hospitalization or death due to COPD than if there were no PM2.5 in the air. The amount of PM2.5 in the air during wildfires in Seattle produced a relative risk for lower respiratory infections of about 2.0, a 100 percent increase in risk. Yet, this was an average day in Delhi. During wildfires in San Francisco and Sydney, PM2.5 exposure meant a 75–100 percent increase in the risk of exacerbated COPD and more than 100 percent increase in the risk of lower respiratory infections.
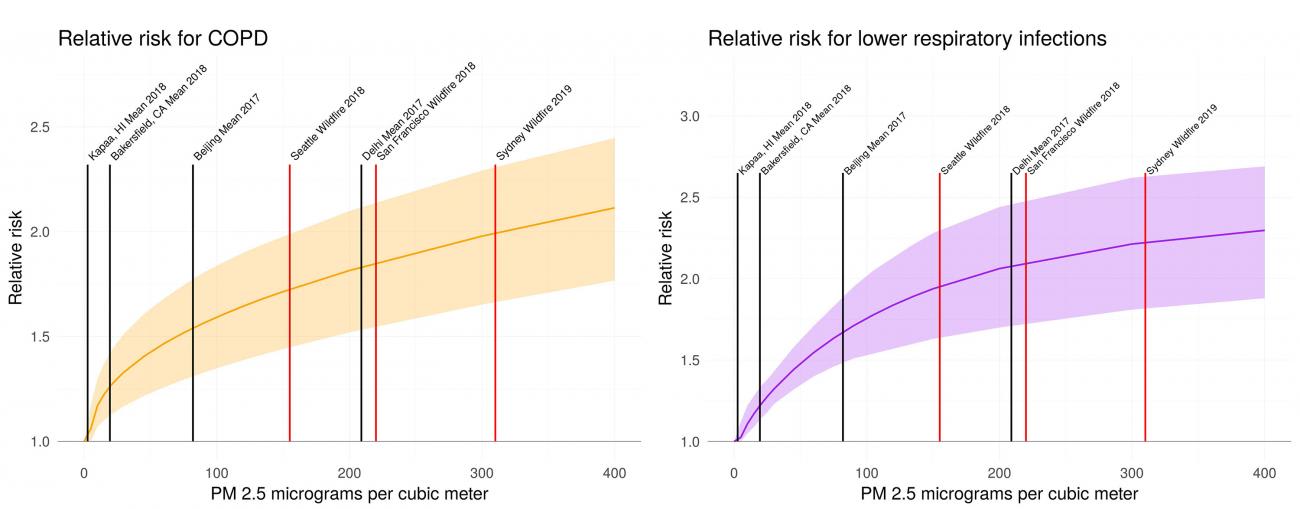
A recent review of the evidence of the impact of wildfire smoke on human health found evidence to support this causal relationship. That review found that among available studies describing the incidence and healthcare visits due to COPD and lower respiratory infections, there were generally consistent increases in these diseases during wildfires.
Over the course of a month, wildfire smoke might be expected to cause more than 30,000 episodes
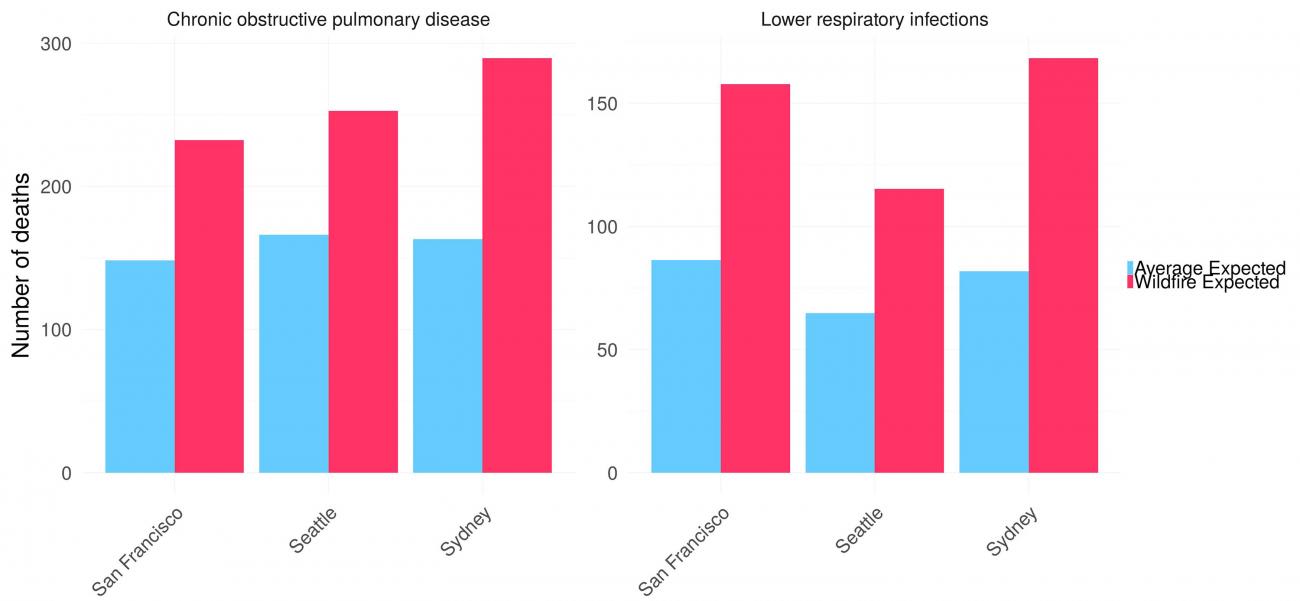
Relative risks can be used to estimate just how many more episodes or deaths might be caused by wildfire PM2.5 pollution. The wildfires in Australia could increase the incidence of lower respiratory infections by two times. That translates to an additional 1,890 cases for every 100,000 people. The elevated PM2.5 concentrations in Sydney, Seattle, and San Francisco could increase the relative risk of lower respiratory infections and COPD by between 1.5 and 2 times. Over the course of a month, wildfire smoke might be expected to cause more than 30,000 episodes and 200 deaths due to lower respiratory infections and 300 deaths due to COPD combined in these three cities.
Wildfires occur naturally, but human behavior is affecting their frequency and intensity. Climate change is expected to increase the frequency and intensity of wildfires even more. Extremely high temperatures, greater than 100 degrees Fahrenheit across much of Australia, leading to dryness have apparently contributed to the bushfires there.
In the Pacific Northwest of the United States, climate models suggest that wildfires could destroy up to 1.1 million acres every year by 2040, mainly due to earlier snowmelt, rising temperatures including heat waves, and drier summers. Strategies to prevent massive wildfires and mitigate exposure to their smoke must be considered a matter of public health.
EDITOR'S NOTE: The author is employed by the University of Washington's Institute for Health Metrics and Evaluation (IHME), which leads the Global Burden of Disease Study. IHME collaborates with the Council on Foreign Relations on Think Global Health. All statements and views expressed in this article are solely those of the individual author and are not necessarily shared by their institution.