Editor's Note: This article is adapted from a blog post at Resolve to Save Lives that summarizes a series of tweets sent by the author at the end of this week—a regular weekly round-up on the COVID-19 pandemic, with a focus on the latest epidemiological data in the United States. This week's tweets focused on travel restrictions, the challenge of teasing out the meaning of test data, information sharing by certain U.S. states, and how the situation in China compares to the United States. The author notes that epidemiology, not politics, should drive action to stop COVID-19.
Reported cases are just the tip of the iceberg
This week saw continued spread of COVID-19 at a high rate in most of the United States, continued test shortages and testing delays and cacophony of confusion about what the data show and what we need to do to control the virus. First, how much coronavirus is out there? Although there's no perfect indicator, I track percent positivity as the least bad indicator. Reported cases are just the tip of the iceberg—these cases reflect both how much spread there is and how much testing and reporting is being done. Although test positivity decreased slightly last week from 7.7 percent to 7.0 percent, it remains high in much of the country and especially in the south. But there's a looming problem with using test positivity to track spread. With antigen tests becoming more widely used but many not reported, we may lose the ability to know of all the positive and negative tests.
Also, most places report the proportion of tests that are positive. Even if cases don't decrease, this proportion can decrease if there's less re-testing of positives (which is generally not needed and perhaps being done less than before).
The proportion of positive tests can also decrease if there's more screening of low-risk people (at schools, universities, and low-risk workplaces). A better indicator to report is the proportion of patients positive, but it's harder, and many places can't do it yet.
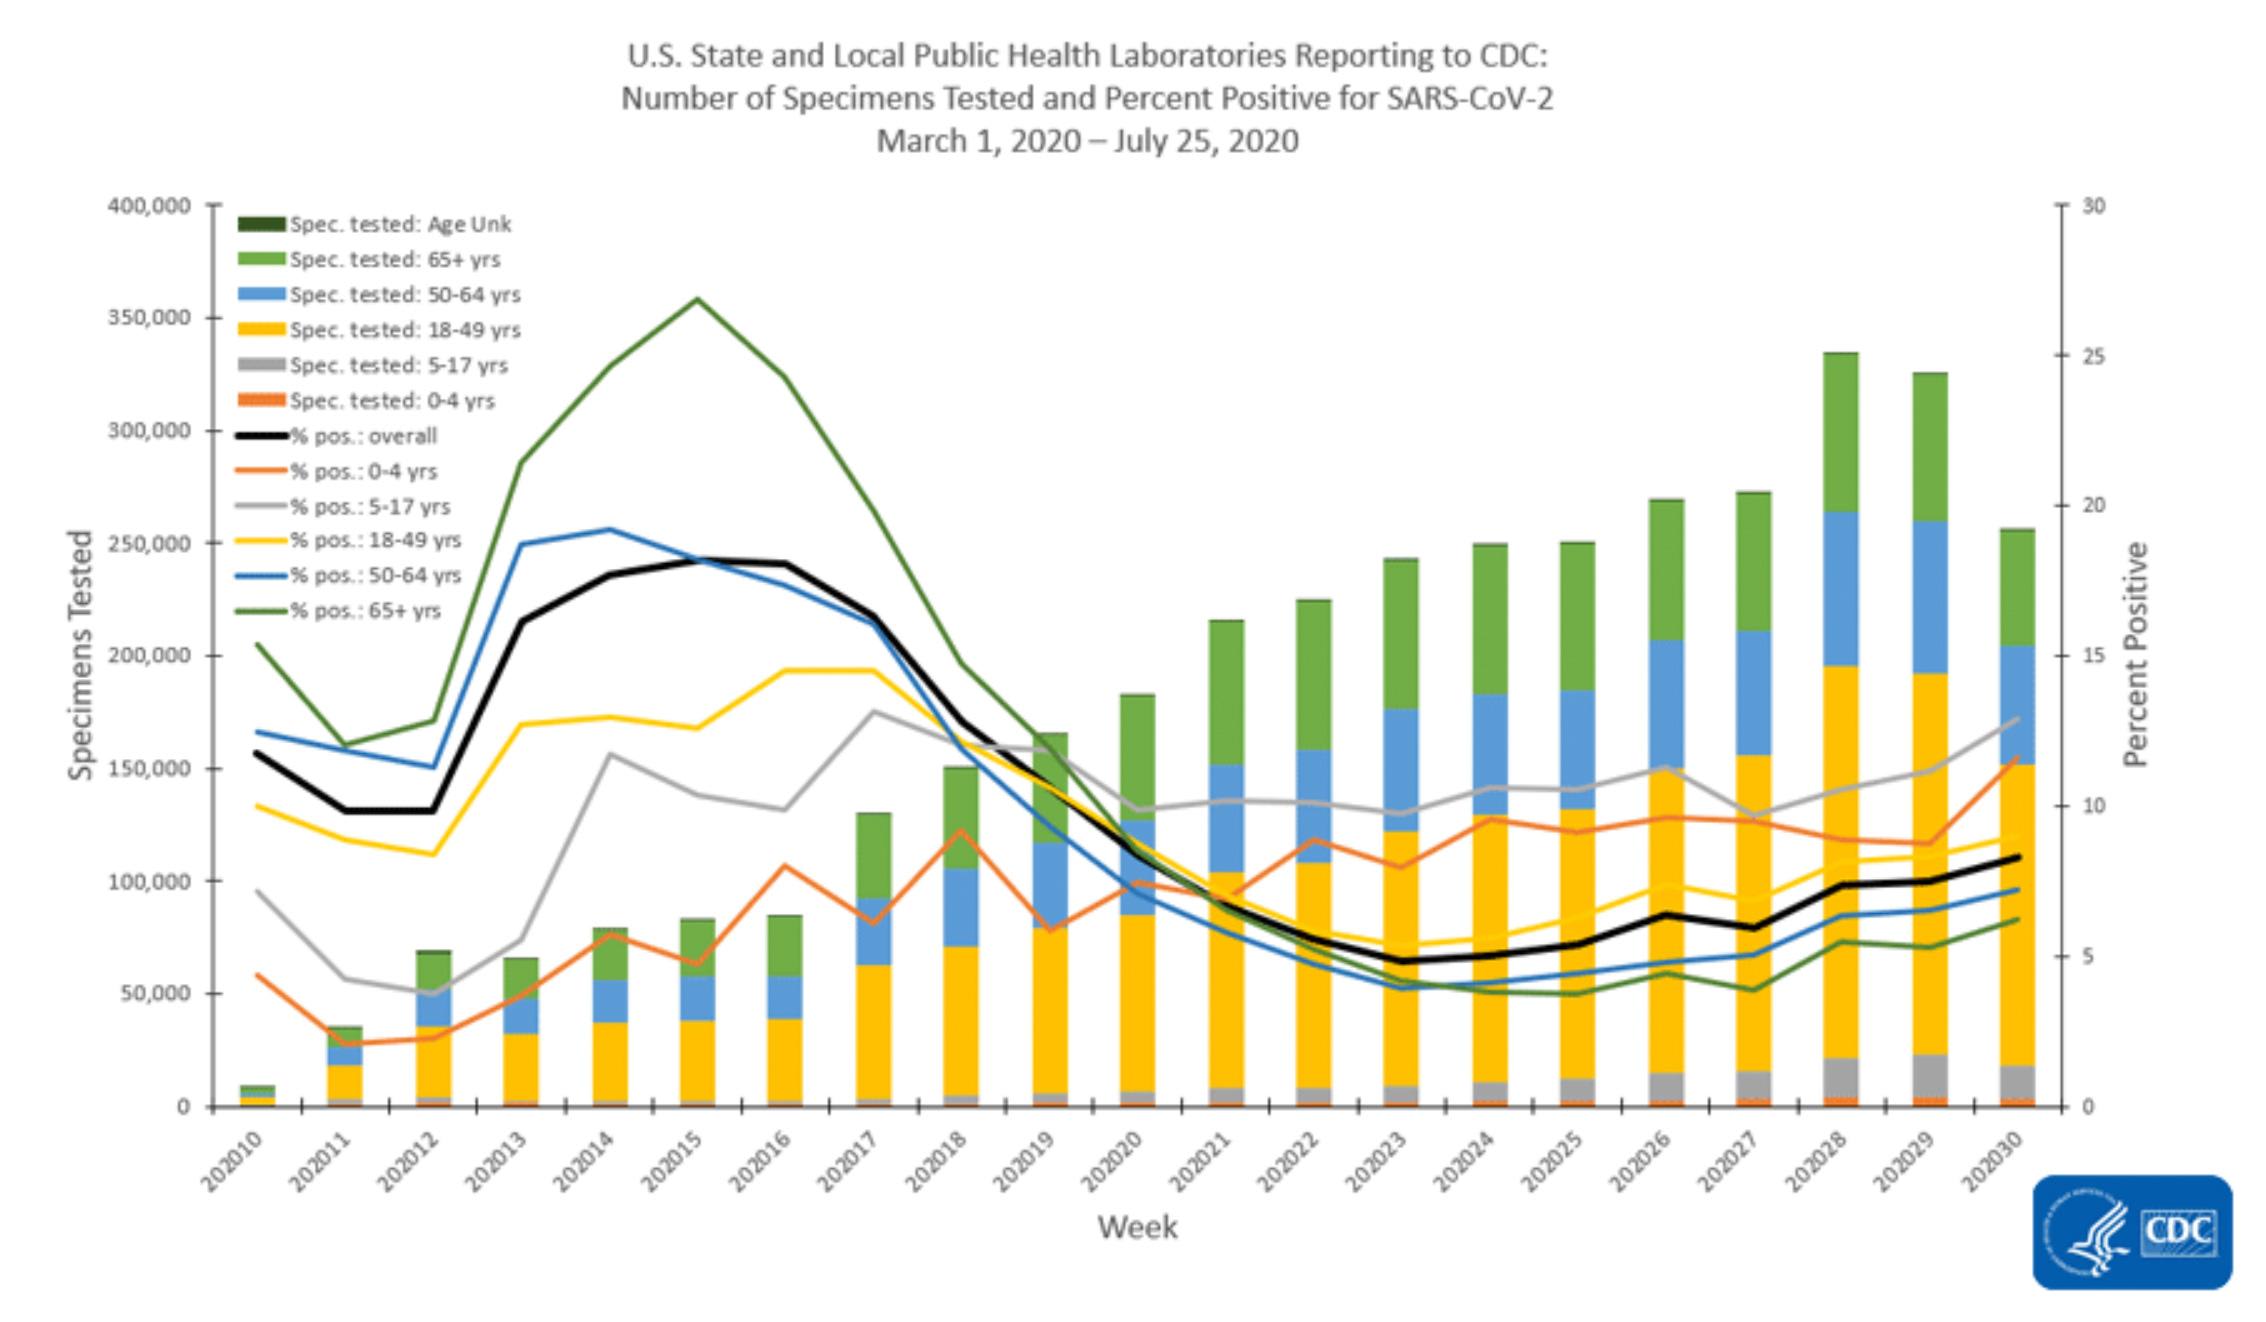
Still, the percent of tests that are positive is very useful. See the gray line on the graph below. Kids aged five to seventeen now have the highest positivity rate of all, and seniors went from the highest rate to the lowest. Age groups aren't islands—if there's more spread among any group, there's more risk for people of all ages.
We would know the equivalent of how much COVID-19 it's "raining" in our community and could protect ourselves better
Case incidence can be misleading. Take Alabama and Alaska. Alabama has less than three times the reported incidence of Alaska, but Alaska is testing at more than three times the absolute rate. Based on this, the actual incidence probably around ten times higher in Alabama, not three times higher, as reported. Even if the accurate incidence is known, the key is to figure out how much of the spread is coming from unlinked cases or uncontrolled clusters. Singapore and other places are doing a good job focusing on this. If we knew how many cases are not connected to known outbreaks or quarantined contacts, we'd know the equivalent of how much COVID-19 it's "raining" in our community and could protect ourselves better. And we should work to get the number of cases that aren't from a known source down to as close to zero as possible. That's what the best programs in the world do, and there's no reason U.S. programs can't do this.
COVID-19 Outbreaks and Cases in Various Louisiana Settings
Of known outbreaks, food processing, bars, industry, casinos, and restaurants are among top settings
For most of the United States, the answer is simple: there's way too much COVID-19 spreading, uncontrolled, in the community. To reduce it, we must close bars, restaurants, and other indoor spaces, reduce gatherings, mask up, wash hands, increase distancing, clean surfaces, and increase ventilation.
If we understand where COVID-19 is spreading, we can reduce risk. Kudos to Louisiana for investigating the source of outbreaks and reporting it openly. Of known outbreaks, food processing, bars, industry, casinos, and—yes—restaurants are the top five. It's a hard truth—bars are definitely a place where coronavirus spreads, and indoor service at restaurants (particularly when bars are closed) isn't very different.
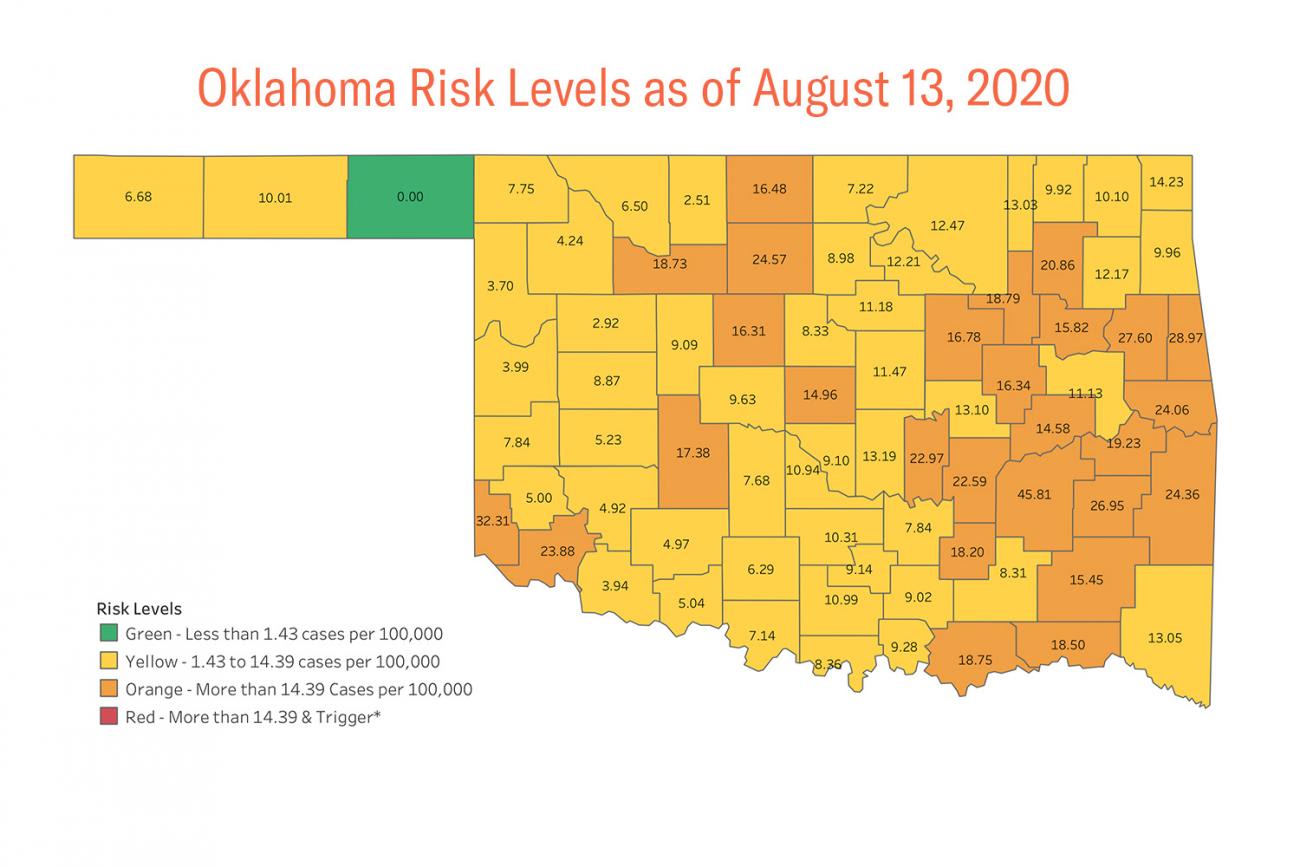
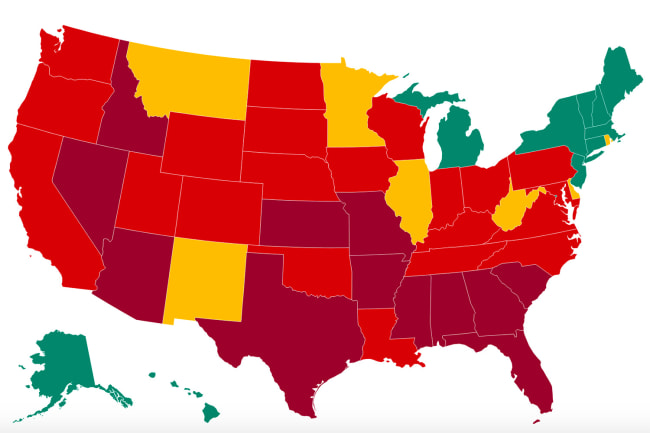
Some other places in the United States are also doing a good job of sharing information on risk with communities: Oklahoma, Alaska, Ohio, Utah, the Southwest district of Idaho, Dallas, and the City of Los Angeles, among others, all of which have implemented COVID-19 alert level systems. (Partial listing here).
An unexpected "health dividend" from COVID-19: less flu
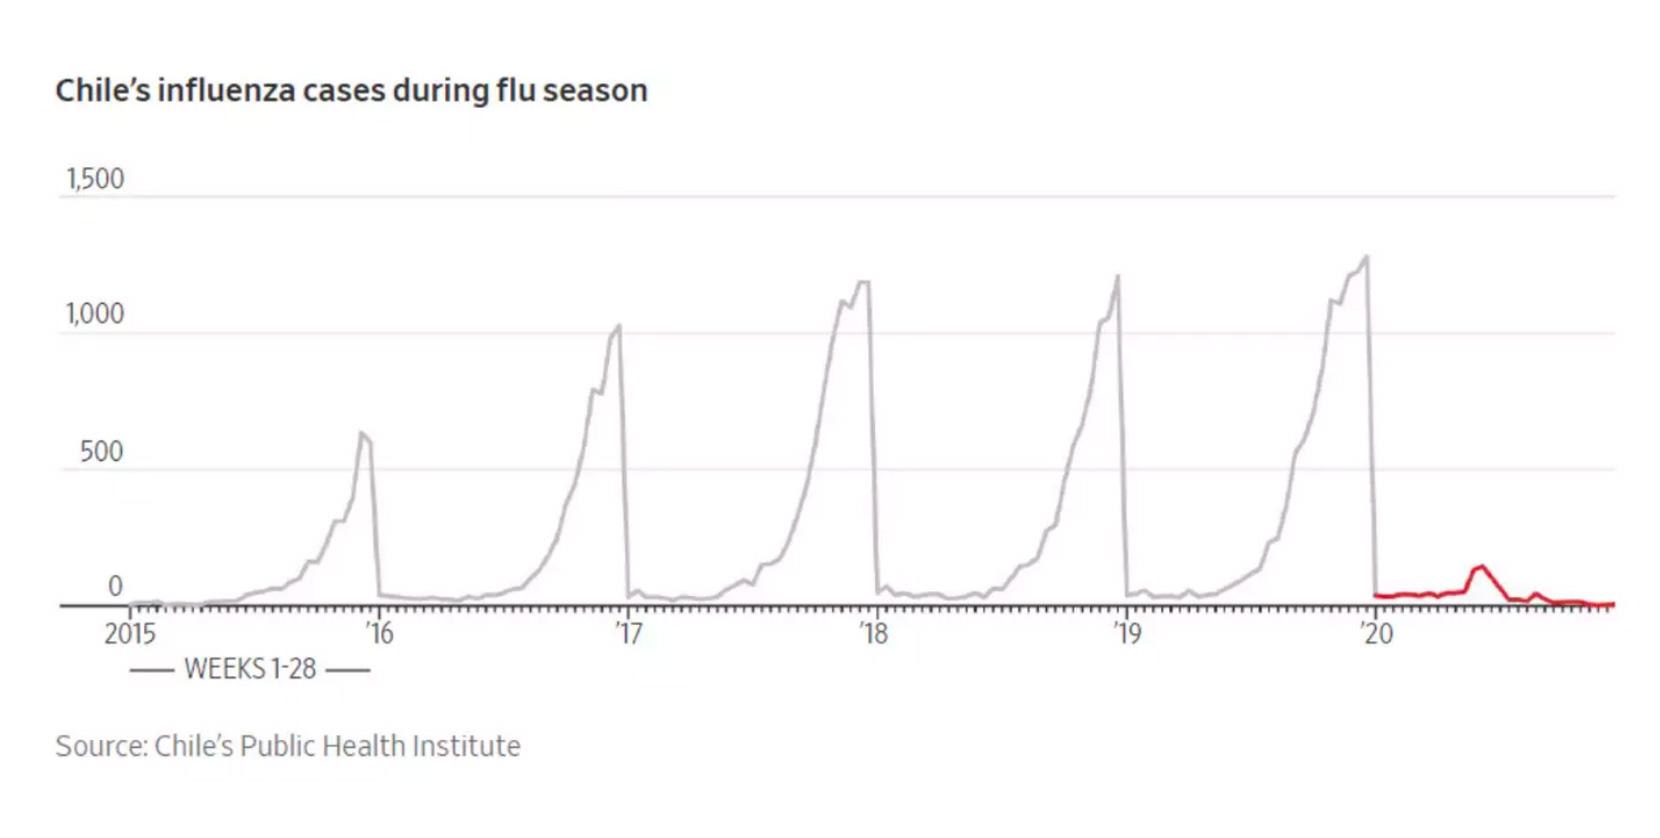
Some public health experts have been concerned about the double burden of flu and COVID-19 in the coming months. Fine to be concerned, but I think this a misguided projection. With less global travel and more masks, hand washing, and distancing, we may actually have a lot less flu. Look at this striking graph from Chile. An unexpected "health dividend" from COVID-19 action could be a much milder flu season. South Africa is finding the same thing, although with more societal contact now, they may see flu in the coming weeks. But still, be sure to get a flu shot, it's the best way to protect yourself from the flu.
Nothing is more important than reducing deaths. This means not just reducing deaths from COVID-19 but also reducing deaths from the disruption caused by COVID-19. According to our prevalence calculator, reported COVID-19 deaths will reach 182,000 in the United States and 870,000 globally within a month.
870,000
Reported COVID-19 deaths are projected to reach 182,000 in the United States and 870,000 globally within a month
In Arizona, Florida, South Carolina, and Texas, there have been more than twice as many excess deaths as COVID-19 deaths. Some of these are undiagnosed or unreported COVID-19 patients and some are from disruption (especially heart attacks). British epidemiologist William Farr wrote, "The death rate is a fact, all else is an inference." COVID-19 kills.The New York Times has an informative article and visualization of how many more people died than usual in each U.S. state and region since the pandemic began. The total number of excess deaths in the country? At least 200,000.
What scares me most about COVID-19? Millions of deaths from the disruption COVID-19 causes other public health programs, mostly in Africa. We must protect health care workers and health care systems, support communities to vaccinate against killer diseases, and continue treatment for HIV, TB, and malaria. China reports that they can now do 4.8 million PCR tests per day. Schools are opening and staying open. Mask-wearing is, where appropriate, nearly universal. Last week, the country of 1.4 billion people reported an average of 34 cases per day. That's a case rate of less than 1/5,000 of the United States.
The past week brought a few notable developments. First, a new study suggests surgical masks are likely a lot better than cloth face coverings; we need to ramp up production and distribution. Second, the question of immunity remains a complicated one, as we discuss in our latest Weekly Science Review, with lots more to learn. Russia announced they're giving a vaccine before studies are complete, a risky gamble.
5,000 to 1
China has a case rate less than 1/5,000 of the United States
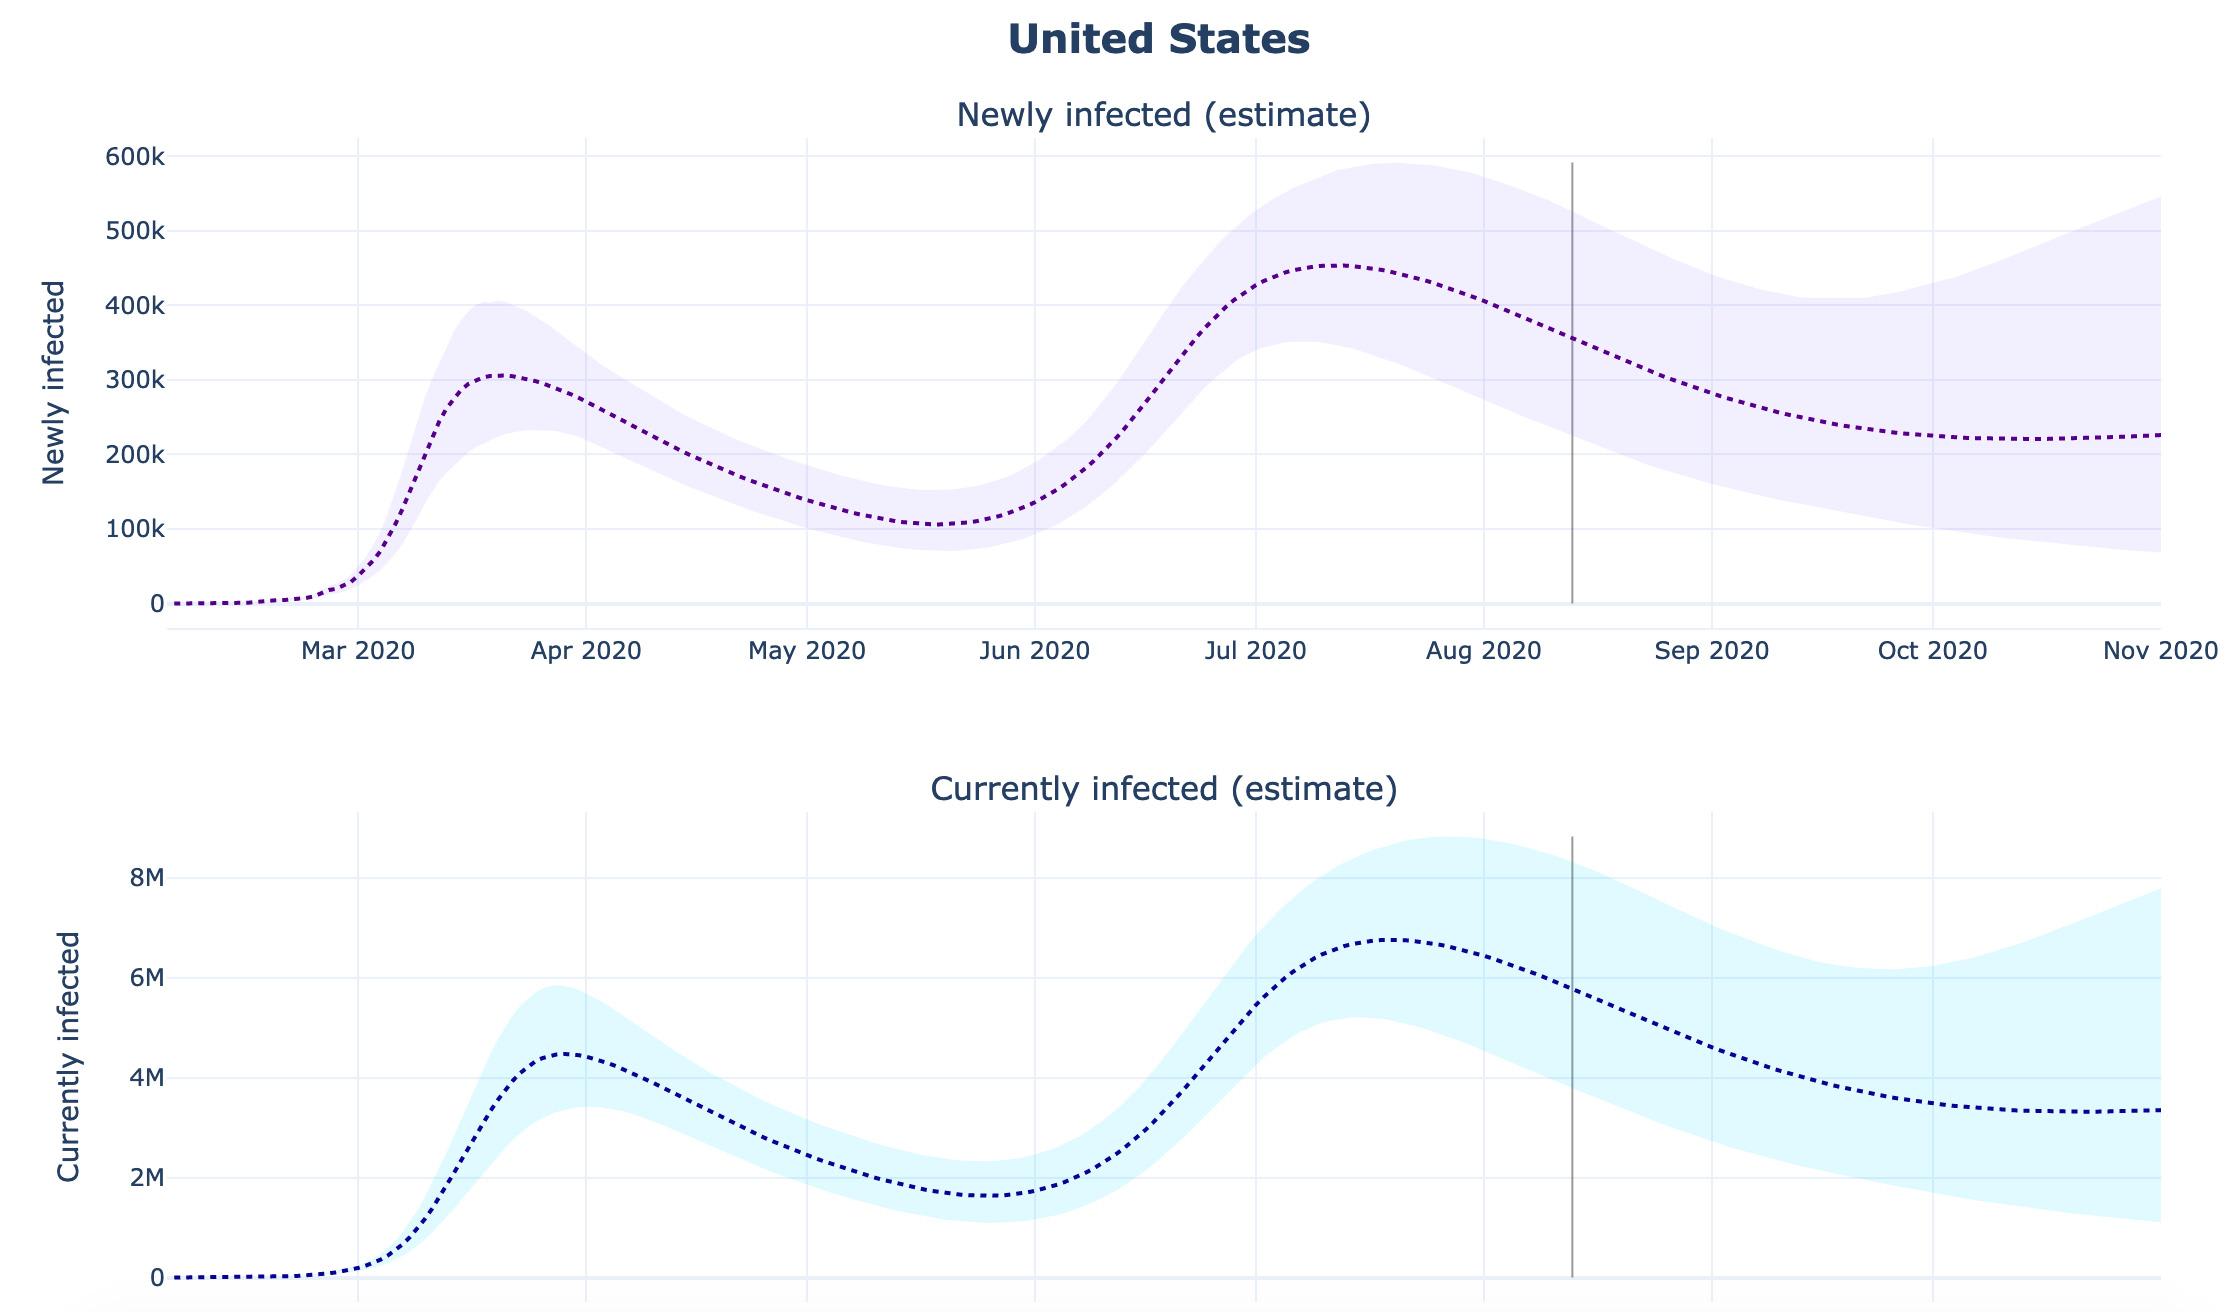
The White House is considering limits on the return of U.S. citizens and permanent residents who have COVID-19 disease or exposure. This is another distraction. The much bigger risk is from people from areas of the United States with COVID-19 rates are much higher than most countries in the world traveling to places like New York, where we have much lower rates. This brings us back to incidence. Modeling is one way to estimate how hard it's raining SARS-CoV-2, the virus that causes COVID-19, in each community. With an estimated 350,000 new infections per day in the United States, that means there's a total of about 2 million infectious people currently, or close to 1/165 of the U.S. population. But the range is very wide.
Texas, Alabama, and other states have an estimated risk of infection about forty times that of New York. Approximately 1 in 60 people in those states are infectious versus about 1 in 2,500 in New York. The risk in New York is about the same as the risk of someone coming from, say, Germany.
Epidemiology, not politics, should drive action
So, you tell me, which makes more epidemiologic sense: restricting travel to New York of Americans coming from Germany, or coming from areas in the US that have failed to control COVID-19? Hint: The risk to New Yorkers is forty times higher for the latter. Epidemiology, not politics, should drive action to stop COVID-19. Australia, Canada, and other countries limit travel within their own borders. As differences in risk of COVID-19 persist, the pressure to reduce travel from lagging states will increase. Control COVID-19 in your community, or please stay put.